
Anoded
Anoded is a B2B platform that monitors large scale battery optimisation in real time.
Year
2023
Responsibilities
Product strategy
User research
Information architecture
UX + UI Design
Team
1x Product Manager
1x Engineering Manager
2x Frontend Developers
3x Backend Developers

Overview
Storing energy from renewables into batteries is an emerging technology that improves the efficiency of the UK grid. Synthesising energy market trading & operational data, Anoded equips battery owners to make the best decisions for their assets. Financial directors use it to stay in touch with their return on investment, while asset operators track the health of their battery in real time.
discovery
In-house workshops
With the help of the CX team's product manager, I led workshops between heads of departments to understand what insights our customers are missing when it comes to their assets' optimisation.
We discussed the need for customers to synthesise between two main facets of their battery, in order to gage the value that their optimiser is bringing them: Commercial and Operational.

The two facets of battery optimisation, dependent on the National Grid’s balancing demands
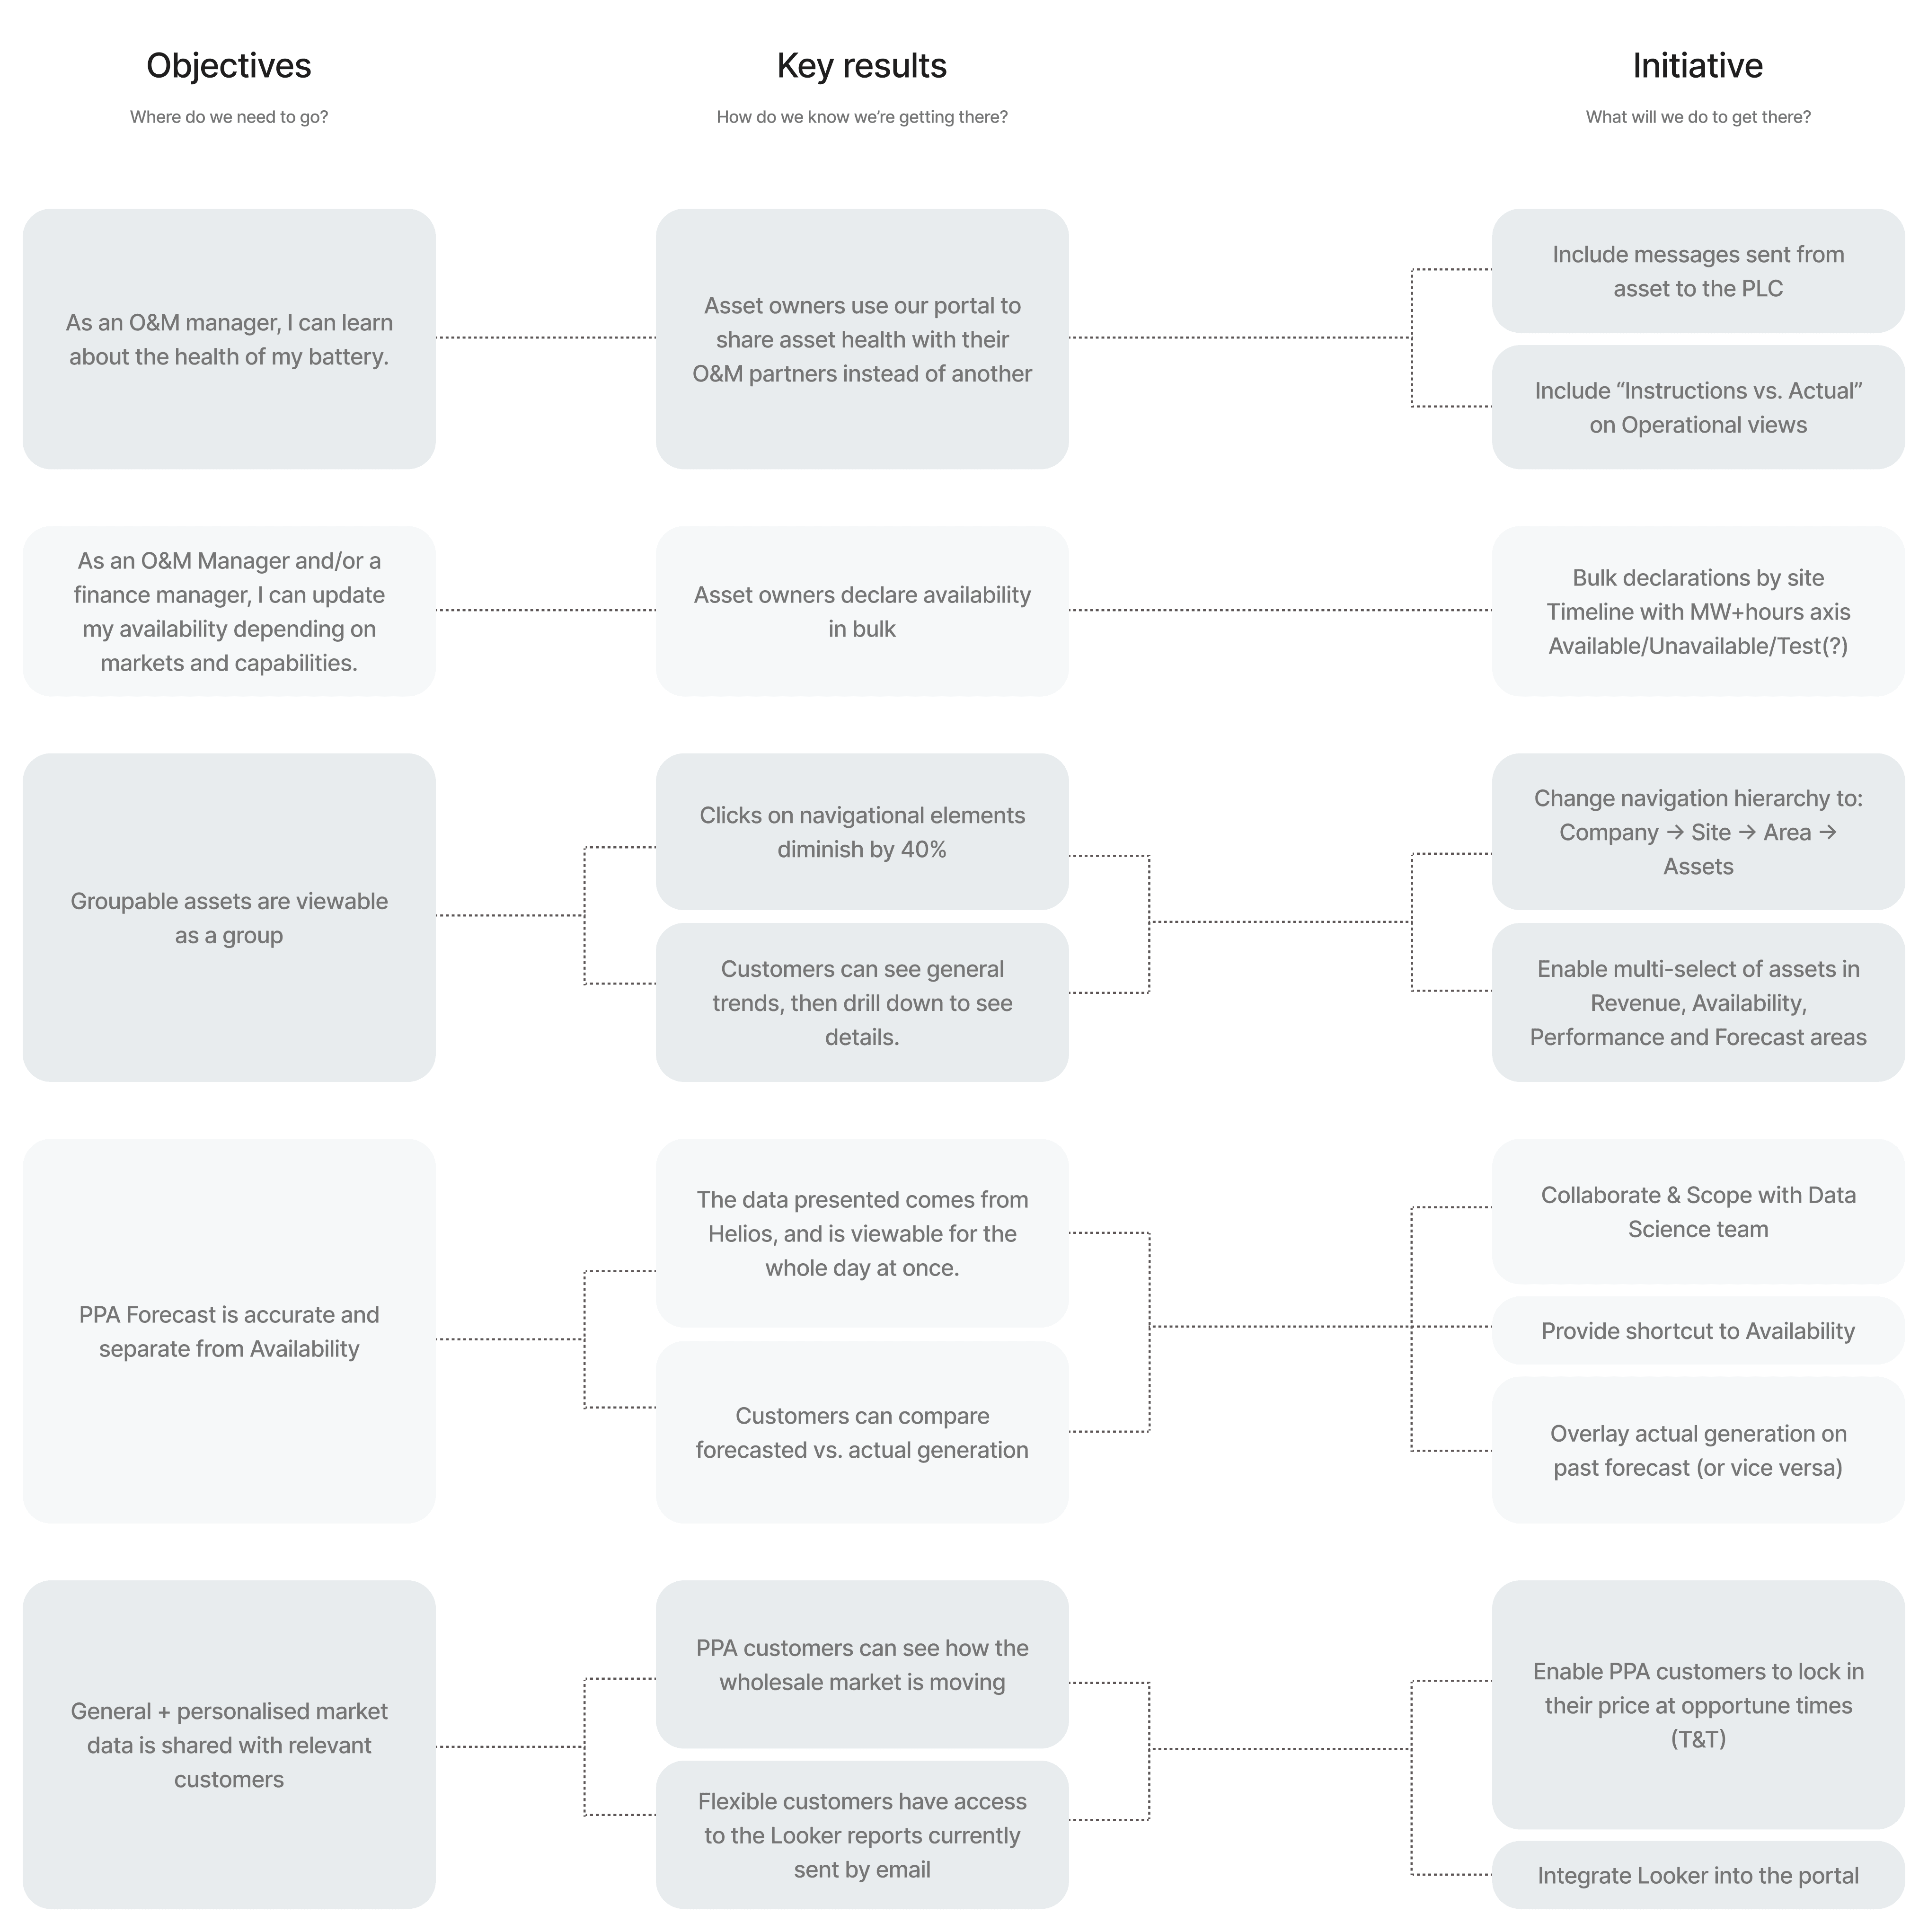
OKR scoping map done with Engineering, Business Development and Account Management teams
discovery
Qualitative research
Given our small amount of battery customers, I got to know them in depth. Their needs were respective of their contract type and familiarity with the energy industry.
I interviewed Financial directors, Operational engineers, and Asset Managers. I shared the research plan across the business for guidance and feedback.

Snippets of our research plan, research sessions and interview synthesis
Define
User problem
There was a pattern of battery owners struggling to understand trading strategies made on their behalf. They relied on their Account Manager to share strategy updates on request, retrospectively.
We defined a high level question that tied various problem spaces into a clear set of user pains, which we kept visible during most of our scoping meetings.

Define
User story mapping
My key role in the Define stage was to draw our stories from the user's POV, and only allow system-focused tasks to be written from and within them.
These stories make up the MVP milestones where user needs, business goals and technical feasibility can gradually meet.

Jira stories written directly from the user story map
Ideate
Sitemap
This map was the first design asset to be tested with close customers. I used the card sorting methodology for items I couldn’t find a name, or a place for.

Sitemap of pages, view filtering and viewable data
Ideate
Wireframing
The strategy was to develop the Optimisation area first as a POC, to allow beta users to track their revenue while we scoped out the Operational area.
I stayed away from refined pixels until we had a structure for the product’s overall content. This made it easier to iterate on options for targeted feedback.

Wireframes on FigJam describing functionality
test
A/B (+C) testing
I gaged how our design decisions performed against our target customers' mental models. And learned to identify smile-frowns.
I mainly used the A/B testing framework, but kept an occasional hidden C option introduced later in the test to contextualise and confirm opinions.

Options for Wholesale trade representation tested with 4 customers
Implement
A focus on transparency
Compartmentalisation
Navigate through individual revenue streams to analyse profit & loss, with the larger context always visible

Progressive disclosure
Grasp the trading strategy through visual cues, then uncover the relevant insights

Summary to details
Skim through the health status of all sites at once, then drill down into specific assets

Data visibility
Get a thorough health assessment of a site or battery, from above the fold. Screenshot and send to a colleague!

Fluid time controls
Dive into a precise timeframe to investigate minute incidents and receive time-based reports

reflection
Problems solved
Complex trading strategies and battery updates are made accessible through visual communication
Health & Safety protocols are more easily implemented given the real-time alerting system
Customers are able to validate their own monthly revenue through transparent and modular data
